
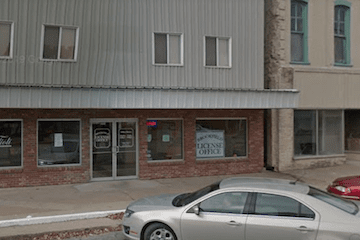
Brookfield License Office
223 North Main Street
Brookfield, MO 64628
Signage Installed
This location is installed and connect to the network!
TV Information
One 55" 1080p HiDefinition TV
Transactions/Impressions
Transactions: 17,795
Estimated Annual Impressions: 480,972
*Based on DoR Transaction Counts
Office Rank
36 out of 37
Cost for Ad Space
* You may qualify for a discount. *
* Please email cassidy@sharpmediallc.com for more information. *
30 Seconds: $125/mo.
60 Seconds: $200/mo.
Demographic Information
Provided by the United States Census Bureau
| Population | |
| Population, Census, April 1, 2020 | 11,874 |
| Age and Sex | |
| Persons under 18 years, percent | 23.3% |
| Persons 65 years and over, percent | 21.4% |
| Female persons, percent | 51.3% |
| Race and Hispanic Origin | |
| White alone, percent | 96.6% |
| Black or African American alone, percent | 0.9% |
| Hispanic or Latino, percent | 2.8% |
| Housing | |
| Median value of owner-occupied housing units, 2016-2020 | $92,600 |
| Median selected monthly owner costs -with a mortgage, 2016-2020 | $874 |
| Median selected monthly owner costs -without a mortgage, 2016-2020 | $874 |
| Median gross rent, 2016-2020 | $559 |
| Families and Living Arrangements | |
| Households, 2016-2020 | 5,002 |
| Persons per household, 2016-2020 | 2.37 |
| Living in same house 1 year ago, percent of persons age 1 year+, 2016-2020 | 90.5% |
| Language other than English spoken at home, percent of persons age 5 years+, 2016-2020 | 3.1% |
| Education | |
| High school graduate or higher, percent of persons age 25 years+, 2016-2020 | 89.2% |
| Bachelor's degree or higher, percent of persons age 25 years+, 2016-2020 | 18.5% |
| Health | |
| With a disability, under age 65 years, percent, 2016-2020 | 9.3% |
| Persons without health insurance, under age 65 years, percent | 13.4% |
| Economy | |
| In civilian labor force, total, percent of population age 16 years+, 2016-2020 | 60.4% |
| Total retail sales, 2022 ($1,000) | Crawford County: 289,834 |
| Total retail sales per capita, 2022 | Crawford County: $12,791 |
| Transportation | |
| Mean travel time to work (minutes), workers age 16 years+, 2016-2020 | 20.8 |
| Income and Poverty | |
| Median household income (in 2020 dollars), 2016-2020 | $51,150 |
| Per capita income in past 12 months (in 2020 dollars), 2016-2020 | $26,961 |
| Persons in poverty, percent | 14.7% |
| Geography | |
| Population per square mile, 2020 | 961 |
